

.png)

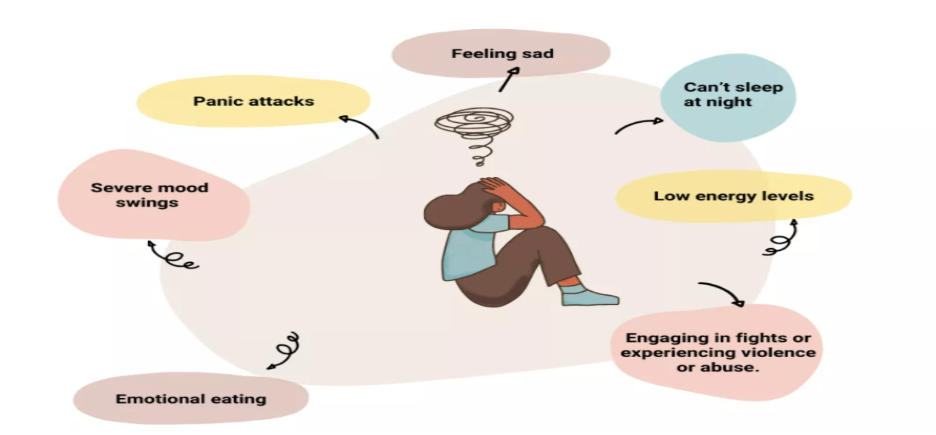
Emotional Risk & Assessment
How to Measure Employee Wellness: 7 Key Metrics & KPIs That Matter

.png)
Written by
Aarohi Parakh,
Psychologist and Content Writer

Reviewed by
Sanjana Sivaram,
Psychologist and Clinical Content Head


Introduction
There is a conversation that happens in boardrooms and HR strategy meetings across corporate India with striking regularity and consistency. Leadership agrees that employee wellness matters. A programme gets approved. A vendor gets onboarded. A launch email goes out. And then, six months later, someone asks: "Is it actually working?"
The silence that follows that question is the most expensive silence in corporate wellness.
Most organisations in India have moved past the question of whether to invest in employee wellness. The business case, the post-pandemic reality, and the rising tide of burnout and attrition have settled that debate. The harder, more honest question is now: how do we know if what we are doing is making any difference?
That is precisely what this blog is for. Not to sell you on wellness, but to help you measure it properly, so that every rupee invested in your people's well-being is tracked, understood, and continuously improved upon.
Whether you are an HR professional building a measurement framework from scratch, a leader making the case to your board, or a wellness programme manager trying to demonstrate impact, this guide walks you through the metrics that matter, the methods that work, and the pitfalls to avoid along the way.
Why Measuring Employee Wellness Matters for Your Organisation
Before diving into specific metrics, it helps to address a question that still surfaces more often than it should: why measure at all?
- The answer is not simply about accountability, though that matters. It is about learning. Wellness programmes that are not measured cannot be improved. They become fixed costs with uncertain returns, and in a climate where every budget line is scrutinised, that makes them vulnerable.
- The business case for measurement is substantial. Research consistently shows that companies with well-structured, monitored wellness programmes see up to 28% lower sick leave usage compared to organisations without them. For every dollar or rupee invested in employee well-being, evidence suggests a return of three to six times that amount in productivity gains, reduced absenteeism, and lower healthcare costs. According to Gallup, neglecting employee wellness can contribute to $322 billion of global turnover and lost productivity. These are not hypothetical projections. They are outcomes that measured programmes have demonstrated repeatedly.
- There is also the retention dimension. In India's current talent market, where attrition in sectors like IT, BFSI, and professional services remains high, wellness has become a differentiator. But only when it is working. And you cannot know if it is working without measuring it.
- The compliance dimension is more pressing than most Indian HR teams realise. Organisations operating internationally or listing on global exchanges are increasingly expected to demonstrate structured wellness governance as part of their ESG and human capital disclosures. For companies with US operations or partnerships, regulations such as HIPAA (which governs the privacy of employee health data) and the ADA (which prohibits discrimination against employees with disabilities, including mental health conditions) create direct obligations around how wellness data is collected, stored, and used. Even for organisations operating solely within India, the Mental Healthcare Act 2017 and the emerging framework around psychosocial hazards under the Occupational Safety, Health and Working Conditions Code 2020 signal a regulatory direction that measurement-ready organisations will be better positioned to meet. Measurement, in this context, is not just good practice. In some contexts, it is legal due diligence.
- Then there is the misconception that has cost more wellness programmes their credibility and their budget than any other single factor: the idea that employee wellness is a "nice to have." It is a phrase that tends to surface when budgets tighten or when a new finance leader joins and starts questioning discretionary spend. And it is fundamentally wrong, not as an opinion, but as a matter of evidence. Wellness is not a benefit in the traditional sense. It is an operating condition. Just as no organisation would consider physical workplace safety optional, psychological and physical health at work is a precondition for the performance, retention, and engagement that every business strategy depends upon. The reason wellness has historically been positioned as optional is that its costs, when ignored, are diffused: they show up in attrition figures, in healthcare claims, in presenteeism, in manager time spent managing people who are struggling. Measurement is precisely what makes those costs visible, and visibility is what moves wellness from the "nice to have" column into the "strategic necessity" one where it belongs.
The measured versus unmeasured gap is real. Organisations that track wellness metrics report significantly higher programme participation, greater leadership buy-in, and stronger ability to make evidence-based decisions about where to invest next. Unmeasured programmes, by contrast, tend to plateau and eventually lose funding. Measurement is not bureaucracy. It is the thing that keeps wellness from becoming just another initiative that had a nice launch and quietly faded away.
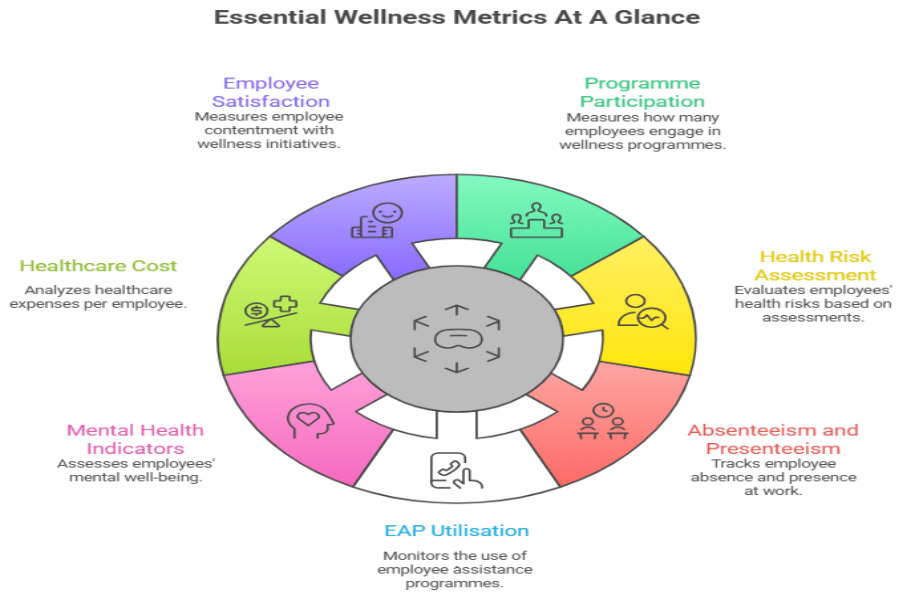
The 7 Essential Employee Wellness Metrics to Track
Think of wellness measurement in three layers: health metrics that tell you what is happening physically and mentally, engagement metrics that tell you how employees are interacting with your programmes, and financial metrics that tell you what it is all costing and returning. The seven metrics below span all three layers.
1. Programme Participation Rate
This is the most immediate indicator of whether your wellness offering is relevant, accessible, and trusted. Participation rate measures the percentage of eligible employees who actively engage with wellness activities, whether that is using the EAP, attending a webinar, completing a health risk assessment, or downloading a wellness app.
The calculation is straightforward: divide the number of active participants by the total number of eligible employees, then multiply by one hundred.
If you have 400 eligible employees and 180 regularly engage with at least one wellness initiative, your participation rate is 45%. Industry benchmarks suggest that healthy programmes typically sit between 40% and 60%. Rates below 30% are a signal worth investigating, not as a performance failure, but as a question: what is getting in the way?
In the Indian context, participation barriers are often cultural rather than logistical. Stigma around mental health support, scepticism about confidentiality, and a general culture of "pushing through" mean that even well-designed programmes can see low uptake if they are not actively normalised by leadership and communicated in ways that feel safe and relevant.

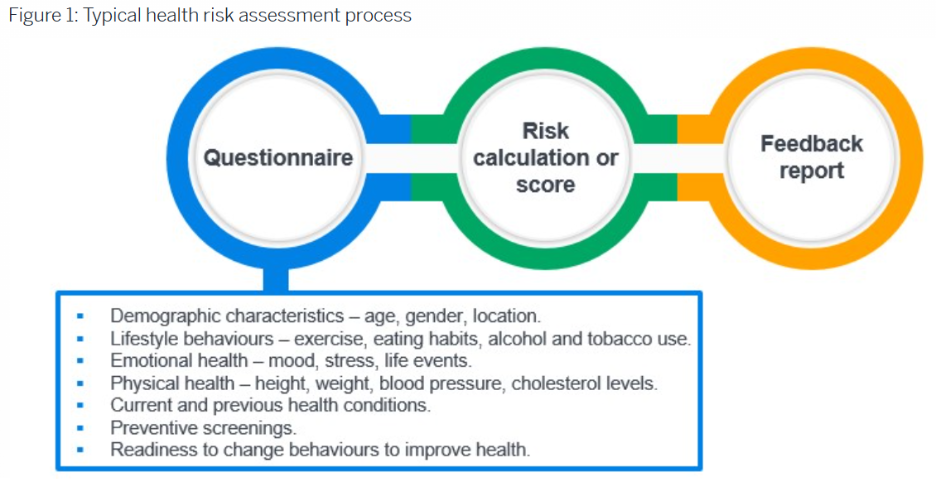
2. Health Risk Assessment Scores
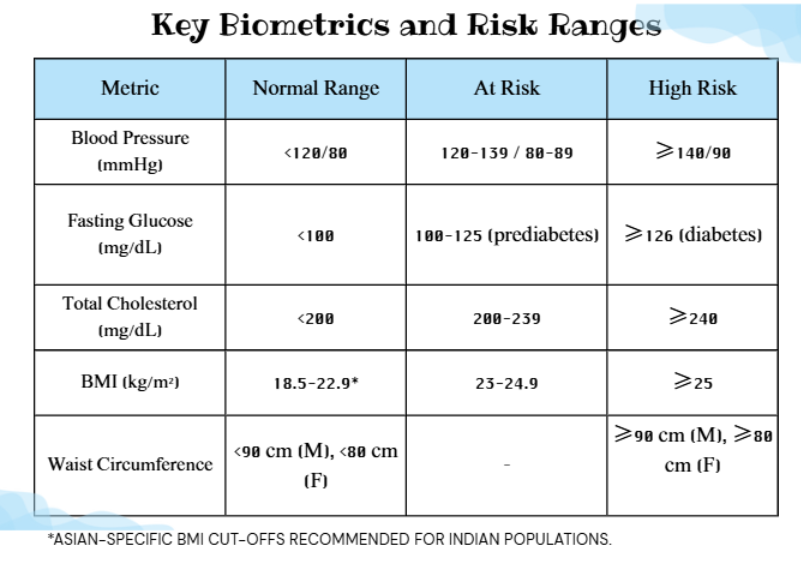
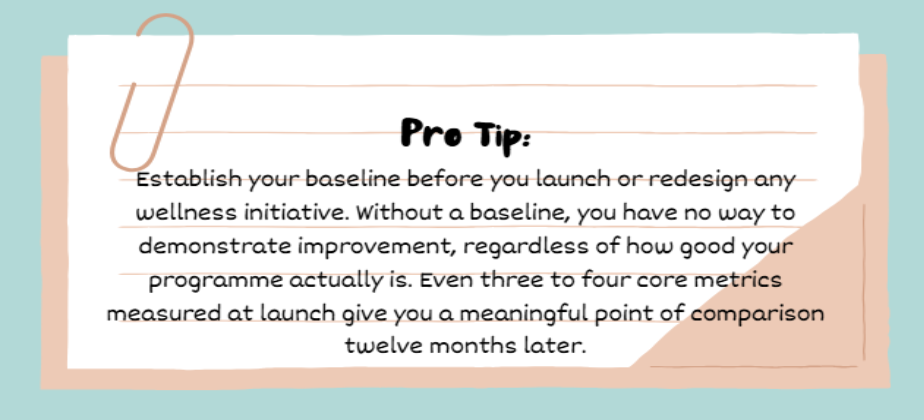
A Health Risk Assessment (HRA) is a structured tool that captures employee health data across key risk categories including body mass index, blood pressure, cholesterol levels, blood glucose, stress levels, sleep quality, and physical activity. It gives you a population-level picture of where your workforce's health risks are concentrated, and it provides a baseline against which to measure change over time.
The most useful aspect of HRAs is not any single data point but the shift in distribution over time. If 38% of your employees fall into a high-stress risk category at baseline and that figure drops to 27% after twelve months of structured wellness intervention, that movement is both meaningful and demonstrable.
Run HRAs at onboarding to capture baseline data, and then annually to track population-level trends. For programmes focused specifically on mental health, validated tools such as the PHQ-9 for depression and the GAD-7 for anxiety provide standardised, clinically recognised measures that give your data real credibility.
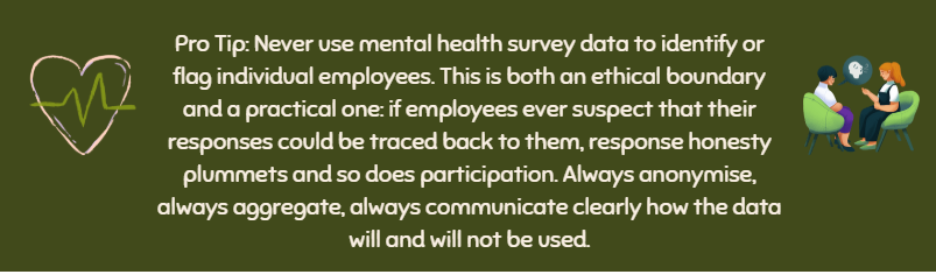
Privacy must be handled carefully here. Individual HRA results should never be visible to line managers or HR. Aggregated, anonymised data is what the organisation needs. The moment employees suspect their personal health data could be accessed by their employer in a way that affects their career, participation collapses.

3. Absenteeism and Presenteeism Rates
These two metrics together give you the most complete picture of how mental and physical health are affecting your organisation's output, and they are often where the financial case for wellness investment becomes most visible.
Absenteeism is relatively straightforward: the number of days lost to unplanned illness or health-related absence, expressed as a percentage of total available working days.

Although benchmarks vary by sector, company size, industry type, healthy organisations target absenteeism rates below 2.5%.
Presenteeism is harder to measure but considerably more costly. It describes the productivity lost when employees are physically present at work but operating below capacity due to poor physical or mental health. Research suggests that presenteeism costs organisations roughly five to ten times more than absenteeism, a figure that most finance teams find startling when they first encounter it.
The standard approach to measuring presenteeism is through validated self-report tools such as the Work Productivity and Activity Impairment (WPAI) questionnaire, which asks employees to rate the degree to which health issues have affected their productivity over a defined period.
In India, presenteeism is particularly acute because cultural and professional norms make it very difficult for employees to take sick days, especially for mental health reasons. The result is a workforce that shows up consistently but functions inconsistently, a pattern that is invisible in absence of data but very real in output quality, customer satisfaction, and team dynamics.

4. Employee Assistance Programme (EAP) Utilisation Rate
If your organisation offers an EAP, utilisation rate is one of the most telling metrics available to you. It measures the percentage of eligible employees who access EAP services within a given period, and it functions as a proxy for both programme awareness and the degree of psychological safety in your organisation.
The Indian corporate average for EAP counselling utilisation sits at just 4.6%, according to the 1to1help State of Emotional Wellbeing Report 2025. That is not a sign that employees do not need support. It is a sign that something is getting in the way. This is especially true during the maternity transition, where a structured maternity benefit programme can surface and address support gaps that a general EAP often misses.
An emotional risk survey helps surface exactly what that 'something' is — identifying the specific dimensions of stress, resilience, and burnout across cohorts before it reaches crisis level.
Track utilisation quarterly and by employee segment. A sustained increase in utilisation is generally a positive sign, indicating growing trust and normalisation. However, a sudden spike may signal that something specific has gone wrong in the working environment and needs attention. Also track the nature of presenting issues within the EAP where your provider shares that data in aggregate form. The 1to1help 2025 report found that among Indian corporate employees who did seek support, anxiety, work-related stress, and relationship issues were the most commonly cited concerns. That kind of data helps you design preventive interventions that target the real drivers of distress in your organisation.

5. Mental Health Indicators
Mental health measurement deserves its own category rather than being folded into general wellness data. This is partly because mental health conditions account for a disproportionate share of both absenteeism and presenteeism, and partly because the data tells you things that physical health metrics cannot.
Key indicators to track include:
- the percentage of employees reporting high or very high stress in anonymous surveys,
- burnout scores measured through validated tools such as the Maslach Burnout Inventory,
- EAP mental health utilisation as a share of total EAP usage,
- and the ratio of employees reporting that they feel psychologically safe enough to discuss health concerns with their manager.
For Indian organisations, this last indicator is especially important. A 2022 McKinsey survey found that over 40% of Indian employees were at risk of burnout or depression. Yet the vast majority did not seek help, precisely because they did not feel safe doing so. Tracking psychological safety as a leading indicator, rather than waiting for burnout and attrition data as lagging ones, gives HR teams the ability to act early.
Use language in your surveys that is accessible and non-clinical. Rather than asking "Do you experience anxiety at work?" try "How often in the past two weeks have you felt overwhelmed by your workload?" The question addresses the same underlying concern but in a way that does not require employees to self-identify with a medical label, which significantly improves response honesty.
6. Healthcare Cost Per Employee
This is the metric that tends to get the attention of finance leaders and CFOs, and for good reason. Tracking healthcare cost per employee, measured on a per-employee-per-month (PEPM) basis, allows you to see whether your wellness investment is having a measurable impact on the organisation's overall health expenditure.
The analysis involves comparing medical claims data, including outpatient, inpatient, pharmacy, and mental health claims, year-on-year, and adjusting for workforce size changes. A well-functioning wellness programme should, over two to three years, show either a reduction in per-employee healthcare costs or a moderation in the rate of cost growth compared to industry trends.
It is important to be honest about the limitations here. Healthcare cost trends are influenced by many factors, including macroeconomic conditions, healthcare inflation, demographic shifts in your workforce, and changes in your benefits structure. Attributing cost movements solely to your wellness programme is neither accurate nor credible. What you can do is track trends, look for correlations, and present the data transparently as one signal among several rather than a direct proof of causation.
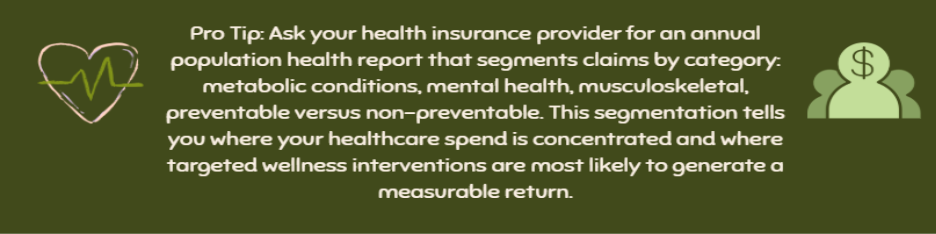
For Indian organisations that self-insure or manage their own health insurance pools, this data is often more accessible than for those relying entirely on group insurance providers. If your insurer can provide segmented claims data by risk category or programme participation status, that comparison, participants versus non-participants, is one of the most compelling data sets you can build.
7. Employee Wellness Satisfaction and Net Promoter Score
All the metrics above measure what is happening. This one measures how employees feel about what you are doing about it. Wellness programme satisfaction, measured through short periodic surveys and through a dedicated Net Promoter Score (NPS), tells you whether your offering is perceived as relevant, accessible, and worth engaging with.
The wellness NPS works like any NPS: ask employees "On a scale of zero to ten, how likely are you to recommend our wellness programme to a colleague?" Scores of nine and ten are promoters; seven and eight are passives; six and below are detractors. Subtract the percentage of detractors from the percentage of promoters to get your NPS.
A healthy wellness NPS for a corporate programme sits above 30. Scores below zero indicate that your detractors outnumber your promoters, which is a clear signal that the programme needs redesigning rather than just better marketing. Supplement NPS with three to five open-ended questions asking employees what they find most and least useful, what is missing, and what would make them more likely to engage. This qualitative data is often more actionable than any quantitative score.

In Indian workplaces, satisfaction data frequently surfaces a gap between what organisations offer and what employees actually need. Programmes heavy on physical wellness content (gym subsidies, step challenges, yoga sessions) but light on mental health support, financial wellness, or career development often score poorly on relevance among younger employee cohorts, who are consistently the most stressed and the least served.
How to Collect and Analyse Wellness Data
Knowing what to measure is one challenge. Knowing how to collect that data reliably, ethically, and without bombarding employees with surveys is another.
The most effective wellness measurement frameworks use a mix of methods rather than relying on a single source. Each method has genuine strengths and real limitations, and understanding both helps you design a data collection strategy that is both robust and sustainable.
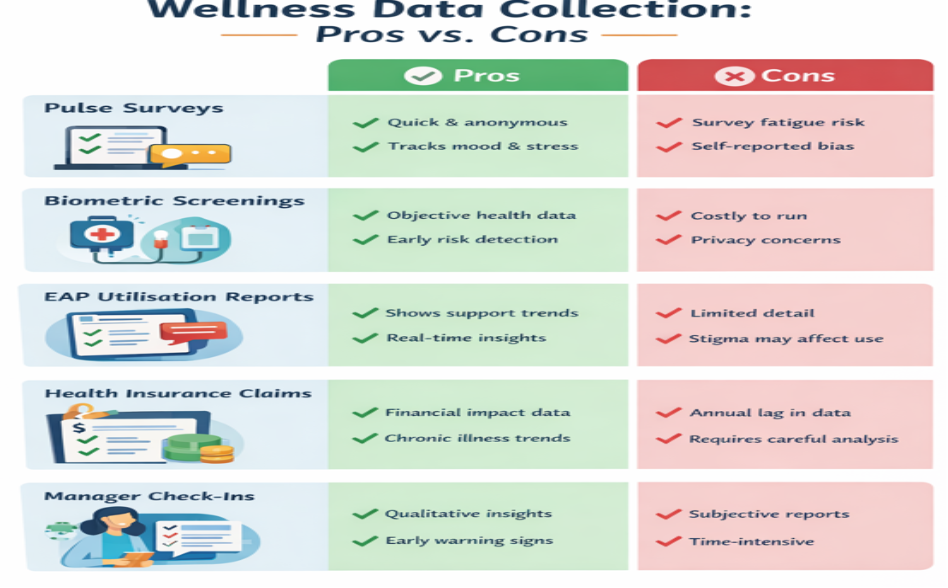
- Anonymous pulse surveys are the most versatile tool available. Short, frequent, and digitally administered, they can capture stress levels, satisfaction, workload perceptions, and psychological safety with minimal burden. The key is brevity: five to eight questions maximum per survey, quarterly frequency, and a clear communication about how responses are used and protected.
- Biometric screenings provide objective health data that self-report surveys cannot. Annual health camps or screening days, conducted by clinical professionals, generate population-level data on blood pressure, glucose, cholesterol, and BMI. For Indian organisations, partnering with an occupational health provider or a corporate wellness platform makes this logistically straightforward. Annual screenings are standard for most organisations. However, employees identified as “at-risk” (e.g., prediabetes, hypertension) may benefit from biannual follow-ups to monitor progression and intervention impact.
- EAP utilisation data is usually provided directly by your EAP vendor in aggregate form. Quarterly utilisation reports, segmented by presenting issue category, give you a real-time picture of what is actually driving your employees to seek support.
- Health insurance claims data, where accessible, provides the most financially relevant picture of population health. The challenge is that it is typically available only on an annual basis and requires careful interpretation to avoid over-attribution.
- Manager-reported observations through structured check-in templates can surface early warning signs of distress, withdrawal, or deteriorating performance that quantitative data will not catch. This is a qualitative layer that should supplement, not replace, structured measurement.
Privacy Considerations: When it comes to data management, keep wellness data separate from HR performance data at all times. Use a dedicated wellness platform or EAP system that stores data independently of your HR Information System (HRIS). Make the separation explicit and communicable to employees. The moment wellness data feels connected to performance management, trust in the programme evaporates.
Setting Wellness Measurement Goals and Benchmarks
Data without goals is observation. Goals without data are hope. The point where the two meet is where meaningful wellness measurement actually lives.
- Use the SMART framework to set wellness measurement goals. Each goal should be Specific (which metric, which population), Measurable (expressed as a number or percentage), Achievable (based on realistic improvement rates), Relevant (connected to a genuine business or health outcome), and Time-bound (with a clear review date).
A well-formed wellness goal sounds like this: "Increase EAP utilisation from 4.6% to 7% among employees in the 25 to 35 age band within twelve months, by increasing programme visibility through a quarterly communication series and two manager-led team briefings per year." That goal names the metric, the baseline, the target, the population segment, the timeline, and the intervention. It is trackable, accountable, and gives whoever owns it clear criteria for success.
- Industry benchmarks provide useful reference points, though they should be treated as context rather than universal targets. Participation rates of 40% to 60% are considered healthy for most corporate wellness programmes. EAP utilisation of 5% to 8% represents a reasonable medium-term target for Indian organisations currently sitting below 5%. Absenteeism below 2.5% is a widely cited benchmark across sectors. Wellness NPS above 30 indicates a programme that is genuinely valued.

Distinguish carefully between leading and lagging indicators when setting goals. Lagging indicators, like reduced healthcare costs and lower turnover, tell you what has already happened. They are important for ROI conversations but slow to move. Leading indicators, like improved participation, rising EAP utilisation, and better psychological safety scores, tell you whether the conditions for improvement are being created. A well-balanced measurement strategy tracks both.
Common Challenges in Measuring Employee Wellness
This blog on wellness measurement would be incomplete without addressing what makes it difficult. These challenges are real, and acknowledging them is not pessimism. It is practical preparation.
- Data privacy and employee trust is the most significant barrier in Indian workplaces. Research consistently shows that employees are reluctant to participate in wellness surveys or health screenings if they believe their responses could be seen by their manager or influence their career trajectory. The solution is architecture: structurally separating wellness data from HR systems, using anonymisation by design, communicating privacy protections clearly and repeatedly, and ensuring that wellness vendors operate under strict confidentiality agreements.
- Attribution is the challenge that can frustrate data-minded leaders most. If your healthcare costs fell this year, was it your wellness programme, or was it the fact that you hired a younger cohort, or that flu season was mild, or that you changed insurers? Isolating the impact of a wellness programme from all the other variables that affect employee health is genuinely difficult. The honest approach is to track trends over time, present data transparently alongside the caveats, and focus on directional movement rather than claiming precise causal proof.
- Survey fatigue is a growing problem in organisations that have over-indexed on employee feedback tools. When employees are asked to complete four or five different surveys per quarter, participation drops and response quality deteriorates. The solution is consolidation and intentionality. Each survey you send should have a clear purpose, a short format, and a visible follow-through showing what changed as a result of previous feedback.
- Low participation in wellness programmes, particularly among the employees who need them most, is a structural challenge that measurement alone cannot solve. But measurement can identify it. If your highest-risk employees are your lowest engagers, that pattern surfaces in your data and gives you a specific problem to solve through outreach design, manager involvement, or reducing barriers to access.

Tools and Platforms for Wellness Measurement
The good news is that the tools available for wellness measurement have improved substantially over the past few years. The less good news is that no single tool does everything well, and selecting the wrong platform can create as many problems as it solves.
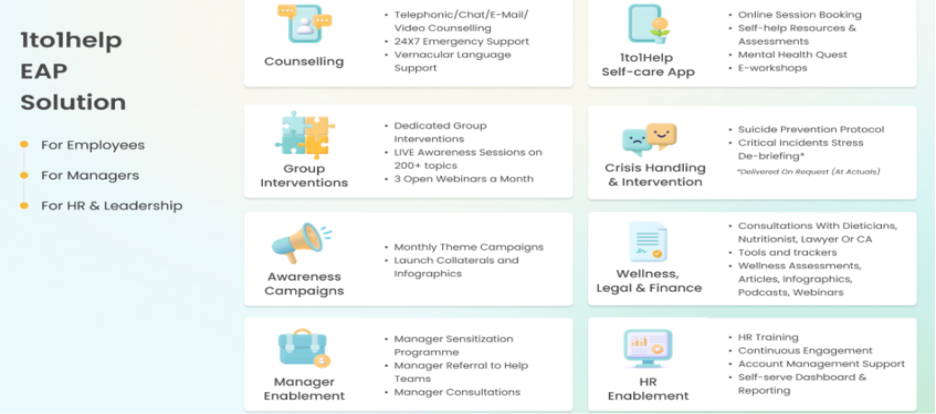
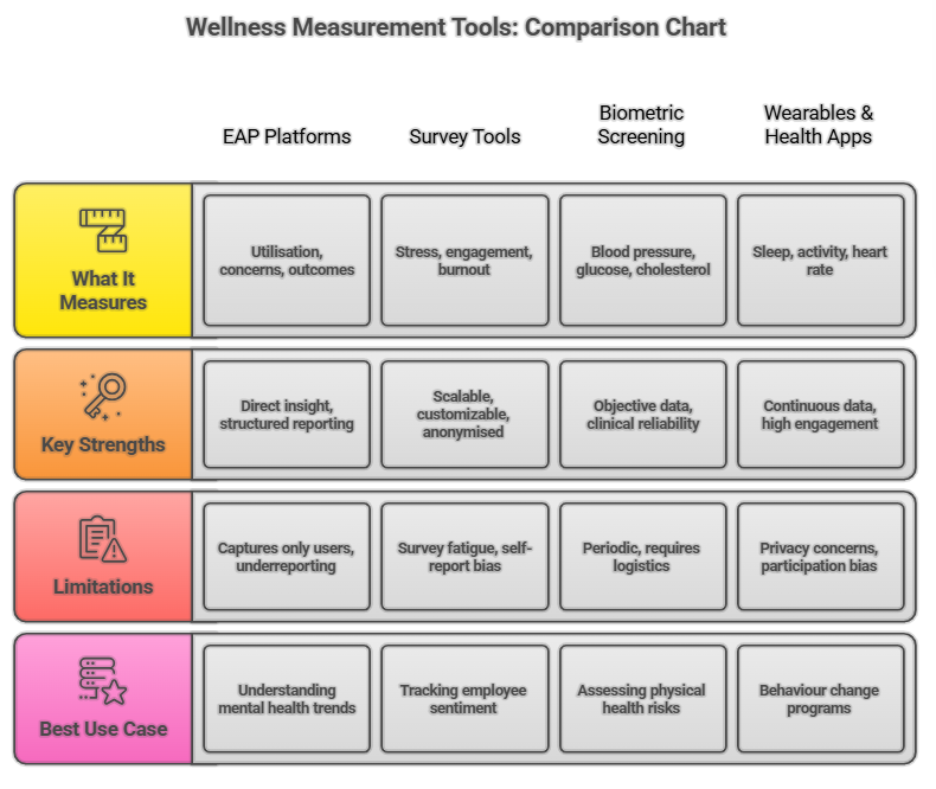
- EAP platforms with embedded analytics, like 1to1help, provide utilisation data, presenting issue trends, and outcome metrics (symptom reduction, session completion) in a structured reporting format. For Indian organisations, choosing a platform with demonstrated India-specific data and regional language capability is important.
- Survey tools like Qualtrics, Culture Amp, and Leapsome allow you to design, deploy, and analyse wellness surveys with varying degrees of sophistication. They integrate with most HRIS systems, support anonymisation, and produce dashboards that HR teams can work with without requiring data science expertise.
- Biometric screening platforms, typically offered through occupational health providers or wellness vendors, generate standardised health data that can be tracked over time. Several Indian corporate health providers offer annual screening camps that produce anonymised population-level reports.
- Wearables and health apps are increasingly used in corporate wellness programmes, particularly among younger workforces. They generate rich behavioural data around sleep, activity, and stress. The privacy considerations here are significant: participation must be genuinely voluntary, data must remain with the employee unless they choose to share it, and employer access should be limited to anonymised aggregate trends.
When evaluating any wellness measurement tool, prioritise four features above all others: data security certification, anonymisation by design, integration capability with your existing HRIS, and quality of reporting output. A tool that generates aesthetic dashboards but cannot integrate with your payroll system creates a data management burden. A tool that integrates well but anonymises poorly creates a trust problem. Both matter equally.
A Final Word on Measuring What Matters
Measuring employee wellness is not about surveillance, accountability, or proving that HR's programmes deserve their budget, though it certainly helps with the last one. At its best, measurement is an act of genuine organisational curiosity: a commitment to understanding how your people are really doing, beneath the professional veneer that most of us maintain at work.
The organisations that do this well are not necessarily the ones with the most sophisticated tools or the largest wellness budgets. They are the ones that ask consistently, listen carefully, act visibly, and come back the following quarter to show employees that something changed because of what they shared.
In India's evolving workplace landscape, where the conversation about employee mental and physical health has finally arrived at the centre rather than the margins, measurement is what separates a genuine commitment from a performative one. It is what allows you to say, with evidence rather than hope: this is working, this needs to change, and here is what we are going to do about it.
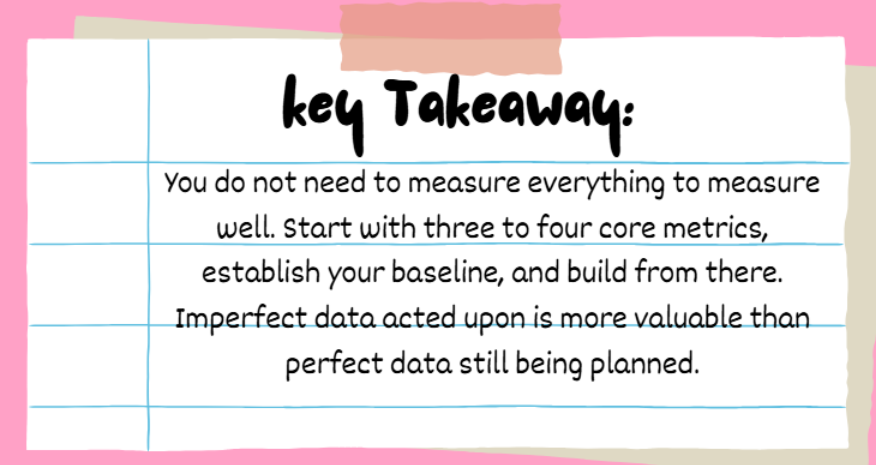
Start small. Start honest. And start now.
Want to Understand the Mental Health Data Within Your Organisation?
1to1help's Employee Assistance Programme comes with structured utilisation reporting, presenting issue analytics, and outcome measurement built in. With over 25 years of experience supporting Indian corporate workforces and data from more than 100,000 counselling sessions annually, 1to1help gives HR and CHRO teams the measurement infrastructure to move from intuition to evidence.
[Speak to a 1to1help Specialist About Wellness Measurement]
Because the most important data you can have about your organisation is not financial. It is human.
FAQs
Q1. What is the best way to start measuring employee wellness if we have nothing in place?
Run a short anonymous baseline survey of eight questions covering stress levels, awareness of current wellness resources, workload manageability, and psychological safety with managers. Share results openly and state what you will do differently. That one exercise gives you your baseline, signals commitment, and builds the trust needed for deeper measurement later.
Q2. How often should we measure employee wellness?
Match the frequency to the metric. Pulse surveys on stress and workload: quarterly. EAP utilisation: monthly for your wellness lead, quarterly for HR leadership. HRAs, biometric data, and healthcare claims: annually. Participation rates: in real time where your platform allows. The goal is a steady enough cadence to spot trends, not just isolated snapshots.
Q3. What is a good participation rate for a corporate wellness programme in India?
A rate of 40% to 50% is a realistic medium-term target. New programmes will start lower. Programmes with visible leadership endorsement and active manager involvement can sustain above 55%. Avoid benchmarking against global figures without accounting for India-specific barriers around stigma and confidentiality.
Q4. How do we measure the ROI of our wellness programme?
You need three inputs: total programme costs, baseline metrics (absenteeism rate, healthcare cost per employee, turnover rate) captured before launch, and outcomes data measured twelve to twenty-four months in. Quantify improvements in monetary terms, subtract costs, divide by costs. Be transparent about what you can reasonably attribute to the programme versus other variables.
Q5. What metrics matter most if we can only track three?
EAP utilisation rate, absenteeism rate, and wellness programme NPS. The first tells you whether employees are accessing support. The second tells you whether health is affecting attendance. The third tells you whether the programme is actually valued. Together, they give you a working picture of need, impact, and relevance.
Q6. How do we protect employee privacy in wellness data collection?
Collect and report only anonymised, aggregate data. Store wellness data separately from HR performance systems and communicate that separation clearly to employees. Vet vendors on their data security and confidentiality protocols before signing. Trust is not a soft outcome here. It is what makes participation possible in the first place.
Resources
- Employee Wellness Dashboard Visualisation
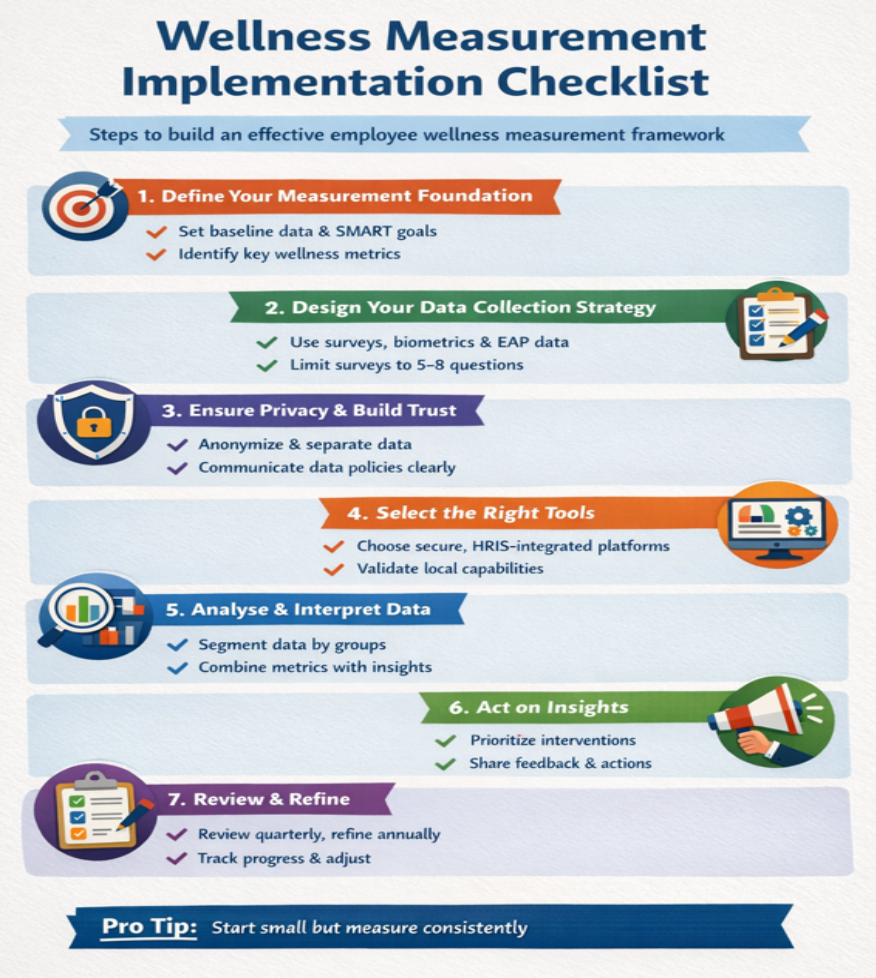
- Wellness Measurement Implementation Checklist
References
- American Diabetes Association. (n.d.). Diagnosis. https://diabetes.org/about-diabetes/diagnosis
- American Heart Association. (n.d.). Understanding blood pressure readings. https://www.heart.org/en/health-topics/high-blood-pressure/understanding-blood-pressure-readings
- Asana. (n.d.). SMART goals: How to make your goals achievable. https://asana.com/resources/smart-goals
- BambooHR. (n.d.). How to make well-being a part of your KPIs. https://www.bamboohr.com/blog/how-to-make-well-being-a-part-of-your-kpis
- Benepass. (n.d.). 7 ways to measure ROI for wellness programs. https://getbenepass.com/blog/7-ways-to-measure-roi-for-wellness-programs
- Cleveland Clinic. (n.d.). Blood glucose test. https://my.clevelandclinic.org/health/diagnostics/12363-blood-glucose-test
- Cornerstone. (n.d.). The ROI of employee well-being programs: A CHRO’s perspective. https://cornerstone.co.in/the-roi-of-employee-well-being-programs-a-chros-perspective
- Healthline. (n.d.). What to know about biometric screening. https://www.healthline.com/health/what-to-know-about-a-biometric-screening
- Health Team Advantage. (n.d.). Health risk assessment. https://healthteamadvantage.com/health-risk-assessment
- Indeed. (n.d.). Mental health in the workplace. https://in.indeed.com/hire/c/info/mental-health-workplace
- India Code. (2017). Mental Healthcare Act, 2017. https://www.indiacode.nic.in/bitstream/123456789/2249/1/A2017-10.pdf
- Investopedia. (n.d.). Lagging indicator. https://www.investopedia.com/terms/l/laggingindicator.asp
- Investopedia. (n.d.). Leading indicator. https://www.investopedia.com/terms/l/leadingindicator.asp
- Investopedia. (n.d.). Presenteeism. https://www.investopedia.com/terms/p/presenteeism.asp
- Leapsome. (n.d.). Absenteeism rate: Definition and calculation. https://www.leapsome.com/blog/absenteeism-rate
- Meditopia. (n.d.). Employee wellness program statistics. https://meditopia.com/en/forwork/articles/employee-wellness-program-statistics
- MedlinePlus. (n.d.). Cholesterol. https://medlineplus.gov/cholesterol.html
- National Institutes of Health. (2010). Health and productivity management. https://pmc.ncbi.nlm.nih.gov/articles/PMC2867226/
- National Institutes of Health. (2010). Wellness as cost offset. https://pmc.ncbi.nlm.nih.gov/articles/PMC2873731/
- Nature Research. (2018). Body mass index and health risk in Asian populations. https://www.nature.com/articles/s41387-018-0070-9
- People Matters. (n.d.). Bridging the wellness gap. https://www.peoplematters.in/article/wellness/bridging-the-wellness-gap-what-employees-really-want-from-workplace-benefits-44792
- Qualtrics. (n.d.). Net promoter score (NPS). https://www.qualtrics.com/articles/customer-experience/net-promoter-score/
- SurveyMonkey. (n.d.). Net promoter score benchmarks. https://www.surveymonkey.com/learn/customer-feedback/net-promoter-score-benchmarks-customer-loyalty/
- U.S. Department of Health & Human Services. (n.d.). HIPAA. https://www.hhs.gov/hipaa/index.html
- U.S. Department of Justice. (n.d.). Americans with Disabilities Act (ADA). https://www.ada.gov/
- UNICEF. (n.d.). Mental health warning signs. https://www.unicef.org/jordan/stories/mental-health-warning-signs-and-when-ask-help
- Verywell Mind. (n.d.). Attribution in psychology. https://www.verywellmind.com/attribution-social-psychology-2795898
- Wellhub. (n.d.). Benefits of employee wellness programs. https://wellhub.com/en-us/blog/wellness-and-benefits-programs/benefits-of-employee-wellness-program/
- World Health Organization. (n.d.). Mental health at work. https://www.who.int/news-room/fact-sheets/detail/mental-health-at-work